Extensions¶
Intuition (plain-language)
The current paper maps the reach and limits of award-layer screening: cheap records do not prove conduct, and under a reproducible non-circular label they carry no robust cartel-ordering signal net of opportunity. These extensions are the open problems that follow from that deflationary map. Does the audit protocol — splitting an apparent signal into mechanical co-participation exposure, single-case concentration, and any genuine increment — replicate in another jurisdiction (where a residual might actually survive)? Can a screen be made to work prospectively, before an investigation is already underway? And what would a richer integration of the bid layer add? None of these is solved here; they are the research agenda the reach-and-limits framing opens up.
This page collects future-work directions that follow from the paper's central result — that award-layer records order forensic priority rather than prove conduct. Each direction is an open problem, not a claim the current paper already settles.
Scope of this page
Earlier versions of this page reported a structural regime model, classical mechanism diagnostics (M1–M5), a minimum-bidder-rule channel, and a "deployable prospective detector." None of those is part of the current paper. The construct is positioned as an award-layer screen that allocates investigative effort — a way to order forensic priority under costly observability — not a structural cover-bidding model and not a fielded detector. The content below is the forward-looking agenda consistent with that framing.
Cross-Jurisdiction Transfer of the Decomposition Method¶
The paper's durable contribution is a disciplined audit protocol, not a single AUC. An apparent loser-side signal is separated into three parts: a mechanical co-participation exposure component (firms that bid more have more chances to co-appear with anyone, including defendants), a single-case-concentration component (one adjudicated case can dominate the positive labels), and any genuine increment that survives both adjustments. The protocol carries a portable principle: validating an administrative screen against adjudicated cases without adjusting for procurement opportunity systematically over-credits it. The current paper now states this principle as an estimable object — its lead contribution — rather than leaving it as future work: the over-crediting bias \(\Delta = \mathrm{AUC}_{\text{raw}} - \mathrm{AUC}_{\text{opp-adj}}\) is characterized (Appendix C; full grid in the Online Supplement) as a size-bias gap, signs only (↑ in \(\mathrm{CV}(T)\), ↓ in the adjudicated base rate, no closed form), with \(\mathrm{CV}(T)\) as a pre-bid-file leading-order sufficient statistic / diagnostic and the two platforms as two points on one synthetic surface anchored at one empirical point per platform (not an estimated curve).
On BEC-SP the decomposition is deflationary: genuine label-blind
opportunity ranks the label at only AUC 0.553 (ranking by observed
contact reaches 0.905, but that is mechanical label encoding), raw award
score ROC 0.761, within-stratum AUC 0.471 (≈ chance), and only a
fragile nested increment of +0.010 (DeLong p = 0.013) that is not
robust across designs. The open
question was whether on a different procurement system, with a different
adjudication history, a within-stratum increment does survive.
The v23 R&R answers it on a first second platform. Re-running the same
audit on the federal ComprasNet panel (2013–2019, pure Pregão; §5 and
Appendix G of the paper, and AN-043)
returns the same verdict: the opportunity-only term again carries essentially
all the raw discrimination (exposure-only 0.754 ≥ raw 0.744), the within-stratum
residual collapses to chance (0.462), the matched permutation does not reject,
and the negative controls reproduce the order. The deflationary result therefore
ports — what transfers is the audit protocol, not a deployable score. This
remains provisional, not a promotion to Confirmed, because the federal CADE
anchors partially overlap the São Paulo portfolio (same cartels,
establishment-anchored). A genuinely independent cartel anchor — non-overlapping
cases, or another jurisdiction — remains the bar for Confirmed (see
COMPRASNET_PATH_TO_CONFIRMED.md).
Prospective Deployment — A Genuine Open Problem¶
The screen as built is retrospective among incumbents. The strict timing tests make this explicit and do not resolve it: inside the training always-loser pool the out-of-time ordering is only weakly informative (ROC ≈ 0.68), but on the full firm universe a strictly out-of-time ROC is below chance (≈ 0.474, precision@500 = 0 in every rolling-origin year), and a fully sequential strict-timing evaluation is infeasible with the available adjudication dates (23.5% of positives are unrankable entrants). The screen therefore orders who has already accumulated a loser-side footprint, not who will become a cover bidder next.
Making award-layer screening prospective is an open research problem, not something the current paper delivers. It would require either richer time-stamped entry data, an explicit early-warning target distinct from adjudication closure, or a deployment design that updates the ordering as participation accrues. We flag this as future work precisely because the reach-and-limits map shows the current artifact does not clear this bar.
What this paper does NOT claim
The current paper does not deliver a deployable prospective cartel detector. It delivers a method to order forensic priority from cheap records and a map of where that ordering is informative and where it is not. Prospective deployment is listed here as unsolved.
The Architecture of Cover Bidding (Separate JLE Spin-Off)¶
A distinct, separate paper develops the institutional reading of the modal asymmetry: regulation that prescribes how losing bids are placed can mechanically generate a suspect pool of loser-side participants. That argument requires its own theory and its own cross-jurisdiction evidence and is deliberately kept out of the current submission to avoid contaminating the evidence-allocation framing with an institutional-identification claim the BEC data cannot support.
Clearly separate work
"The Architecture of Cover Bidding" is a planned future paper, not a section of the current one. In the present paper the modal asymmetry is reported as scope information (the ordering is more informative in some procurement environments than others), never as a positive test of a minimum-bidder-rule mechanism.
Richer Bid-Layer Integration¶
The benchmark against bid-distribution screens shows conditional complementarity, not dominance: on the single evaluation pool a transparent bid-moment random forest inspired by Imhof–Wallimann-style screens reaches ROC 0.717 / PR 0.116, the award continuous score 0.760 / PR 0.143, and a combined model PR 0.188 under random CV. But under case-grouped folds the combined model falls below award-only on PR (0.103 vs 0.143). The complementarity is conditional on this implemented benchmark and case-fragile, and is read as a division of labor — cheap award-layer records and costly bid-layer features carry different information — not as a claim that one screen beats the other.
The open direction is a deeper integration of the bid layer: which bid-distribution moments add genuine increment after the award-layer ordering and the opportunity adjustment, and whether a jointly estimated model preserves that increment out of time and out of sample. This is a methodological extension of the decomposition, applied to the bid layer rather than the award layer.
Cost–Recall Frontier, Not a Single Operating Point¶
The cost-of-evidence result is a frontier, not a single optimal cutoff. Sequencing a cheap award-layer triage before a costly bid-layer stage traces a curve in (investigation cost, recall) space across a grid of Stage-1 sizes. A single headline operating point is not optimal: at one Stage-1 size the firm-count reduction is large (~88%) while the reduction measured on bid-rows — the denominator that actually drives forensic cost — is far smaller (~33%). Which point an enforcer should choose depends on the relative cost of the two layers and on the recall target, both of which are policy parameters rather than estimable constants.
Modeled modestly: the enforcer stopping rule
This is no longer left as an open "future work to model the decision." The paper states the enforcer's stopping rule (Appendix B) as a standard cost–benefit (MB = MC) tangency — not a grand result: the agency descends the cheap award ranking until marginal recovery per unit forensic cost falls to the cost–value ratio \(c/V\), and sweeping \(c/V\) traces this very frontier as the locus of budget-dependent optima. So the absence of a single fixed cutoff simply follows from the optimum being budget-dependent. The remaining open extension is narrower: characterizing the frontier under explicit, externally calibrated cost denominators for a specific agency.
No 'universal' headline
Earlier drafts summarized this as a single universal "footprint reduction" headline. That framing is retired: the result is a cost–recall frontier, the reduction depends on whether cost is counted in firms or in bid-rows, and no single operating point is optimal across enforcers.
The open extension is to characterize the frontier under explicit, externally calibrated cost denominators for a given enforcement agency, turning the curve into an agency-specific operating recommendation.
Price as Scope, Not Damages¶
The price evidence describes where the ordering is informative, not a recovered overcharge. The broad-sample association is +0.064; under an overlap-cell ATT it reverses to −0.097; only the top revenue quartile remains positive at +0.041. The mechanism behind the sign-structure is not identified from BEC alone. The price object is therefore read as scope information — which segments the ordering speaks to — and the paper does not rest on either sign.
The open question is whether, with cleaner exogenous variation in procurement design, the segment-level structure can be tied to a mechanism rather than left as a descriptive scope map.
Year-by-Year Stability¶
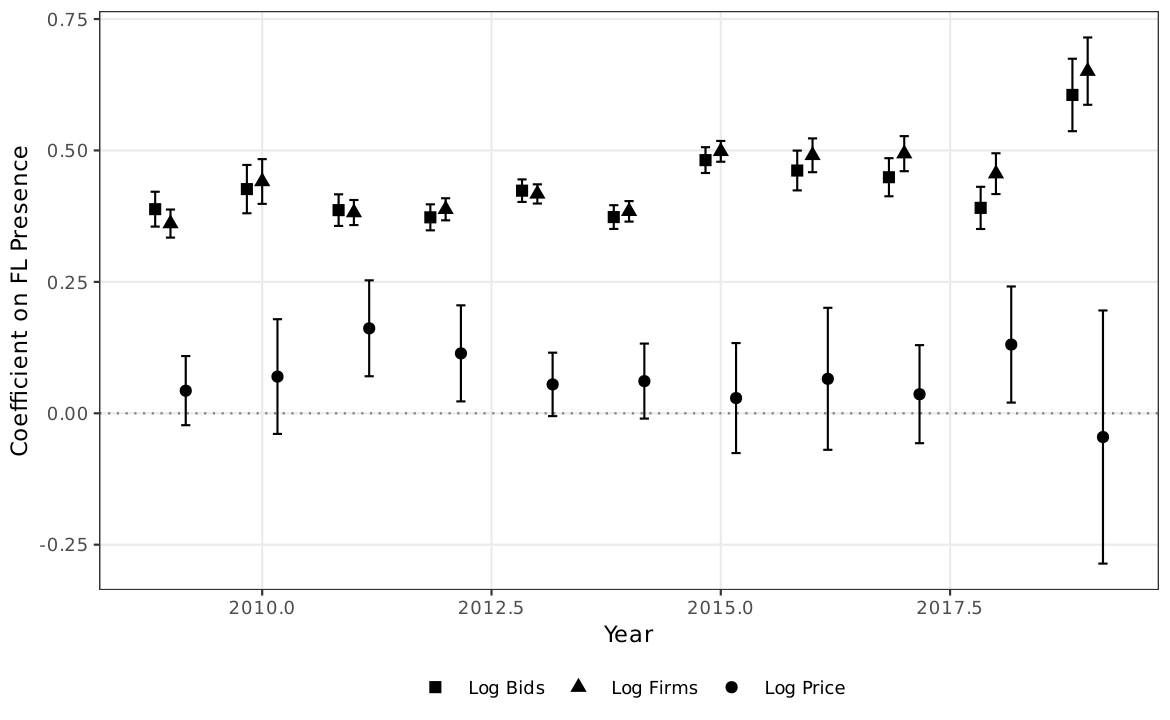
The broad-sample association is stable across years and is not an artifact of any single period. As elsewhere on this site, the broad-sample coefficient is a descriptive scope object; the overlap-restricted ATT reverses sign, and the paper does not rest on either sign of the price coefficient.