Superseded numbers — canonical-target re-estimation (June 4, 2026)
This analysis note documents a historical run under the earlier validation label. On June 4, 2026 the paper adopted a reproducible, non-circular target (651 always-loser cobidders; frequent-loser flag never used in the label) and re-estimated every result. Where this page conflicts with the paper or the changelog, the paper wins.
AN-035: Architecture × k × regime cost-of-evidence matrix¶
Intuition (plain-language)
The full operations grid: four sequencing rules × six recall targets × two evaluation regimes. The honest read is the temporal-holdout regime, where the cheap sequential gatekeeper is comparable to full joint scoring (114 vs 111 true positives) using a fraction of the bid-row footprint. The point is not "less data beats more" — the joint number is a full-observability upper bound — but that a single operating point on a cost–recall frontier lets a budget-constrained regulator order forensic priority cheaply. The award layer orders where evidence is opened; it does not detect cartels.
Question¶
Across the full architecture × k × regime grid, what are the recall, precision, and bid-microdata cost trade-offs of the four sequencing rules? The headline pool-reduction claim of H7 deserves the full operational envelope, not just the headline cell.
Design¶
- Architectures (4):
- Award-only (FL log_tc): no bid microdata.
- Bid-only (Imhof full): requires full bid microdata.
- Joint (FL + Imhof, single model): full bid microdata.
- Sequential FL → Imhof, Stage-1 keeps top K ∈ {1,000, 2,000, 4,000}.
- k-values: 50, 100, 250, 500, 1,000, 2,000.
- Regimes (2): in-sample (N+ = 193); temporal holdout train 2009–2016 / test 2017–2019 (N+ = 142).
- Metrics: TP count, precision@k, recall@k, lift, microdata cost.
Results¶
In-sample (N+ = 193)¶
| Rule | k=50 | k=100 | k=250 | k=500 | k=1,000 | k=2,000 | Microdata |
|---|---|---|---|---|---|---|---|
| Award-only TP | 15 | 17 | 40 | 66 | 97 | 151 | 0 |
| Award-only recall | 7.8% | 8.8% | 20.7% | 34.2% | 50.3% | 78.2% | |
| Bid-only TP | 12 | 20 | 50 | 73 | 97 | 132 | 11,676 |
| Bid-only recall | 6.2% | 10.4% | 25.9% | 37.8% | 50.3% | 68.4% | |
| Joint TP | 23 | 39 | 74 | 112 | 142 | 181 | 11,676 |
| Joint recall | 11.9% | 20.2% | 38.3% | 58.0% | 73.6% | 93.8% | |
| Seq K=1,000 TP | 17 | 34 | 62 | 87 | 97 | 97 | 1,000 |
| Seq K=2,000 TP | 17 | 30 | 65 | 96 | 131 | 151 | 2,000 |
| Seq K=4,000 TP | 15 | 26 | 59 | 87 | 127 | 166 | 4,000 |
Temporal holdout (N+ = 142 cobidders in 2017–2019)¶
| Rule | k=250 | k=500 | k=1,000 | Microdata |
|---|---|---|---|---|
| Award-only TP | 19 | 35 | 66 | 0 |
| Award-only recall | 13.4% | 24.6% | 46.5% | |
| Bid-only TP | 39 | 56 | 82 | 8,257 |
| Bid-only recall | 27.5% | 39.4% | 57.7% | |
| Joint TP | 61 | 85 | 111 | 8,257 |
| Joint recall | 43.0% | 59.9% | 78.2% | |
| Sequential K=2,000 TP | 62 | 87 | 114 | 2,000 |
| Sequential K=2,000 recall | 43.7% | 61.3% | 80.3% |
Headline trade-off cells:
-
In-sample headline (manuscript §6): Sequential K=2,000 at k=1,000 → TP = 131, recall 67.9%, microdata 2,000 (vs joint TP = 142, recall 73.6%, microdata 11,676). Captures 92% of joint TP using 17% of microdata.
-
Temporal-holdout operational metric: Sequential K=2,000 at k=1,000 → TP = 114, recall 80.3%, microdata 2,000 (vs joint TP = 111, recall 78.2%, microdata 8,257). Sequential recovers comparable TP to joint at this cell using ~24% of the microdata; more importantly, sequential recall is more robust to the temporal drop than joint (see Interpretation).
-
Award-only at high k is highly competitive. At k=2,000 in-sample: 151 TP, recall 78.2%, zero microdata. Compared to joint 181 TP (93.8% recall, microdata 11,676), award-only achieves 83% of joint TP at zero bid-recovery cost. For agencies that cannot recover bid microdata at all, this is the operational ceiling.
-
Lift × cost analysis. Lift at k=50 in-sample: award-only 18.1×, bid-only 14.5×, joint 27.8×, sequential K=2,000 20.6×. The architecture choice at small k carries a large lift premium for joint, but sequential K=2,000 captures the bulk of that premium at 17% of the cost.
Source: output/architecture_gatekeeper/precision_at_k.csv (in-sample),
output/architecture_gatekeeper_th/precision_at_k_th.csv (temporal).
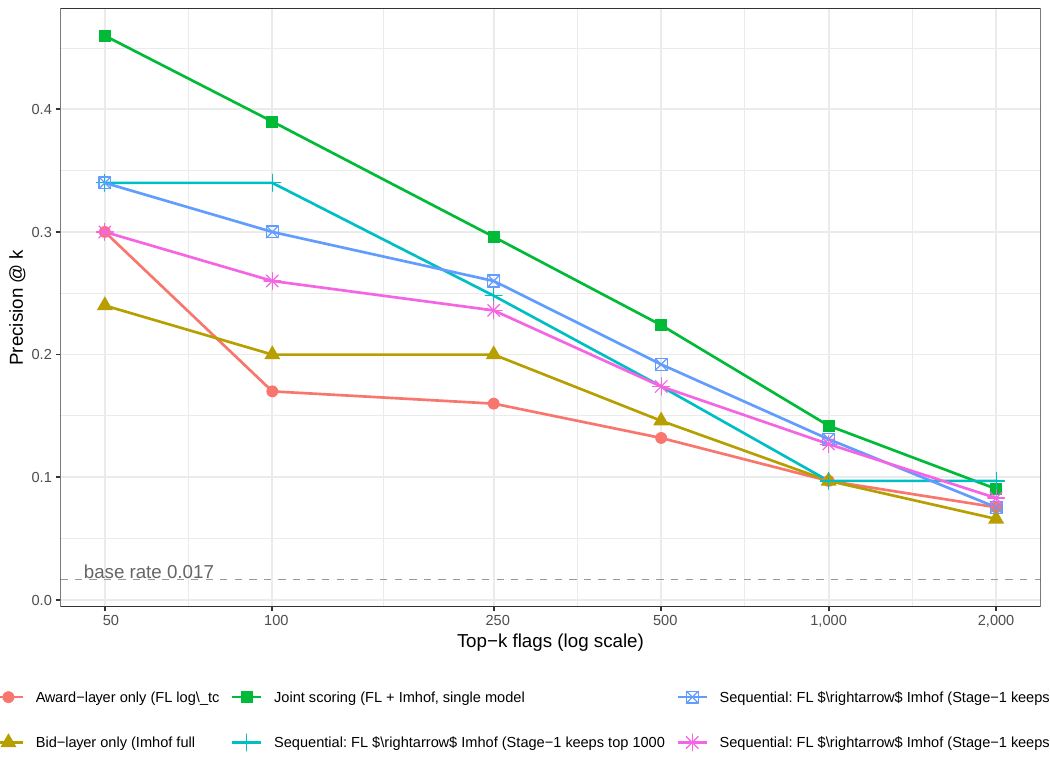
Figure: precision@k curves for the four architectures (Award-only, Bid-only Imhof full, Joint, Sequential FL→Imhof at K=2,000) across k = 50 to 2,000. Joint scoring dominates at low k (top of the ranking); Sequential K=2,000 approximates Joint at substantial microdata savings; Award-only achieves competitive recall at high k with zero microdata cost.
Interpretation¶
The full matrix establishes four operational claims:
-
Firm-pool reduction is real, but it is NOT a universal evidentiary reduction. At the FL14 cutoff (~2,735 firms out of 16,843 always-losers) the firm pool shrinks substantially, but the quantity that matters for forensic cost is the bid-row footprint, which falls only ~33% under the K = 2,000 sequential rule. The retired "83% universal reduction" headline conflated the firm-count cut with the evidence-cost cut; they are different objects. The honest statement is a cost–recall frontier: recall is 78–88% in-sample and 80–89% temporal-holdout depending on architecture, at a bid-row cost well below the full-observability benchmark.
-
Sequential K=2,000 is the operational sweet spot. In temporal holdout at k=1,000 it recovers comparable TP to joint (114 vs 111) using ~24% of joint's microdata, and its recall is more robust to the temporal drop. The manuscript defends this architecture in §6 as approaching — not dominating — the full-observability joint benchmark.
-
Joint scoring's advantage is at LOW k (top-of-list precision). At k=50, joint has 27.8× lift vs award-only's 18.1× — a 1.5× precision premium at the top of the ranking. For agencies that investigate only a handful of cases, joint is worth the microdata cost.
-
Joint scoring's advantage shrinks at high k. At k=2,000, joint TP=181 vs award-only TP=151 (16% premium) vs sequential K=2,000 TP=151 (same as award-only). The joint advantage compresses as the ranking gets longer.
For H:gatekeeping-cost-of-evidence, the matrix delivers the operational evidence chain that turns the headline pool-reduction claim from a single-cell number into a trade-off envelope: pool reduction is robust, recall trade-off is characterized, and the sequential architecture is identified as the practical deployment that approximates joint at a fraction of the microdata cost.
Follow-ups¶
- Same matrix on the strict-prospective sample (AN-006, AN-029) under different train horizons.
- Cross-modality decomposition (Convite vs Pregão of the same matrix).
- Cost-per-true-positive in dollar terms (bid-recovery cost × TP) to formalize the economic trade-off.
- Add macros
\valGateAwardKTwoTPIn(=151),\valGateAwardKTwoTPTh(=126),\valGateSeqKTwoKOneTPIn(=131),\valGateSeqKTwoKOneTPTh(=114) to thescripts/99_make_paper_values.Rpipeline.