Superseded numbers — canonical-target re-estimation (June 4, 2026)
This analysis note documents a historical run under the earlier validation label. On June 4, 2026 the paper adopted a reproducible, non-circular target (651 always-loser cobidders; frequent-loser flag never used in the label) and re-estimated every result. Where this page conflicts with the paper or the changelog, the paper wins.
AN-038: Negative cell + item-group segment audit
Intuition (plain-language)
Where exactly does the sign reversal happen? Group by group: most item groups flip from positive baseline to negative under ATT (e.g. group 13: +0.255 → −0.129). One group (37) stays robustly negative; one (10) stays positive, marking the boundary of the scope reading. The heterogeneity is structured, not random noise — predominantly negative under proper comparison — which is what you'd expect if the positive baseline was a composition artifact rather than a price effect.
Question
At the item-group and operating-cell level, where does the negative FL-price coefficient hold and where does it not? The within-overlap subgroup decomposition (AN-037) showed the negative survives across modality, PBU size, and most tender-value quartiles. This page documents the finer cell-level decomposition.
Design
- Item-group decomposition (
segment_betas.csv): for each top item group (BEC item-group code 10–39), report the three-spec progression — broad, overlap_unweighted, overlap_att. - Cell-by-cell negative audit (
negative_cell_audit.csv): for cells with negative point estimates in the broad spec, report modality, period, PBU-size quartile, tender-value quartile, top item group, and top buyer.
Results
Item-group decomposition (segment_betas.csv)
| Item group | Broad coef | Overlap unweighted | Overlap ATT |
|---|---|---|---|
| 10 | +0.107 | +0.101 | +0.063 (stays positive) |
| 12 | +0.265** | +0.256** | −0.072 (flips) |
| 13 | +0.255 | +0.245 | −0.129* (flips, p = 0.069) |
| 14 | +0.122 | +0.102 | −0.099* (flips, p = 0.059) |
| 17 | +0.582*** | +0.536*** | +0.083 (attenuates, n.s.) |
| 29 | +0.029 | +0.022 | −0.051** (flips, p = 0.019) |
| 37 | −0.105** | −0.125** | −0.126** (stays negative) |
| 39 | −0.065** | −0.066** | −0.103** (stays negative) |
Negative cell audit (negative_cell_audit.csv)
Cells with negative point estimates in the broad spec:
| Dimension | Group | Coef | SE | p | N | Treated share |
|---|---|---|---|---|---|---|
| modality | Convite | −0.062*** | 0.024 | 0.009 | 4,470 | 54.2% |
| modality | Pregão | −0.065** | 0.032 | 0.041 | 2,856 | 49.0% |
| period | 2009–2013 | −0.119* | 0.025 | <10⁻⁵ | 3,842 | 45.6% |
| period | 2014–2016 | +0.009 | 0.033 | 0.796 | 1,999 | 54.5% |
| period | 2017–2019 | −0.055 | 0.090 | 0.540 | 1,485 | 66.1% |
| direct_cade_item | 0 (none) | −0.080* | 0.025 | 0.001 | 7,239 | 51.7% |
| pbu_size_q | 3 | +0.061 | 0.089 | 0.494 | 1,991 | 70.9% |
| pbu_size_q | 4 | −0.126* | 0.022 | <10⁻⁷ | 4,275 | 37.9% |
| tender_value_q | 1 | −0.123* | 0.018 | <10⁻⁹ | 2,577 | 30.7% |
| tender_value_q | 2 | −0.061 | 0.035 | 0.080 | 1,492 | 42.9% |
| tender_value_q | 3 | +0.021 | 0.038 | 0.570 | 1,100 | 65.6% |
| tender_value_q | 4 | −0.045 | 0.109 | 0.679 | 2,157 | 77.4% |
| item_group_top | 37 | −0.182* | 0.022 | <10⁻⁹ | 1,317 | 30.4% |
| item_group_top | Other | +0.058 | 0.052 | 0.261 | 3,242 | 66.3% |
| buyer_top | Other | −0.018 | 0.029 | 0.549 | 5,899 | 57.3% |
Sources: output/sign_reversal_decomp/segment_betas.csv,
output/negative_cell_audit/negative_cell_audit.csv.
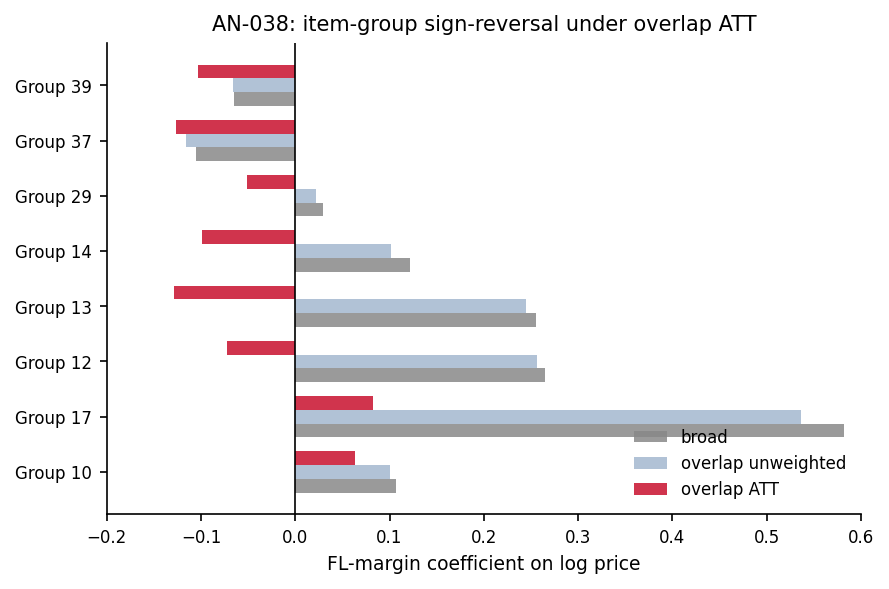
Figure: FL-margin coefficient by item group across three specifications — broad (grey), overlap unweighted (light blue), overlap ATT (red). Groups 12, 13, 14, 29 flip from positive baseline to negative ATT (sign reversal). Group 37 stays negative across all specs (structural negative); group 10 stays positive (structural positive). Predictably structured heterogeneity, not noise.
Interpretation
Three readings:
-
Most item groups flip from positive to negative under overlap ATT: groups 12, 13, 14, 29 all move from positive baseline to negative ATT (sign flip). Group 17 attenuates from +0.582*** to +0.083 (n.s.), losing significance but staying positive — partial sign-flip. Groups 37 and 39 are negative across all specifications — they would never have supported a naive damages reading. Group 10 is the only group that stays clearly positive throughout (+0.107 → +0.063), and even there the ATT spec is not significant.
-
Cell-by-cell, the negative is concentrated in the early period and large-PBU + low-value corner. Period 2009–2013 gives the strongest negative (−0.119, p < 10⁻⁵); period 2014–2016 gives +0.009 (n.s.); period 2017–2019 gives −0.055 (n.s., small N). PBU-size Q4 (largest buyers, but where 38% are treated — low treatment share) gives −0.126; tender-value Q1 (lowest value) gives −0.123. These are the cells where the loser-side scope applies cleanly: routine, low-value tenders with large-PBU procurers.
-
Item-group 37 is the structural negative. Across all three specifications, group 37 has a strongly negative coefficient (−0.105 broad → −0.125 overlap unweighted → −0.126 overlap ATT; all p < 10⁻⁶). This item group is the cleanest case for the scope reading — FL presence is associated with lower observed prices, consistent with cobidder activity occurring in a regime where the underlying price-formation process is also lower-priced (perhaps because high participation correlates with competitive product categories where cartels operate at the margin).
The cell-by-cell heterogeneity is predictably patterned, not random: - Routine, low-value, large-PBU cells → negative (sign-reversed) - Specific item-group categories (37, 39) → negative across specs - Item-group 10 and high-value Q4 → positive (the boundaries of the scope reading) - Item-group 17 → loses significance under ATT (partially flipped)
For H:price-scope-sign-reversal: the cell decomposition strengthens the headline reading by showing the sign reversal is not uniform but predictably structured. The agency deploying the screen should expect: - Robust negative price-FL association in the routine large-PBU low-value corner (the operational deployment target); - Positive or neutral association in specific item groups and high-value tenders (scope boundaries to communicate to courts).
The reading is 🟡 because the cell-level patterns are observational and depend on item-group taxonomy choices; promotion to 🟢 requires either independent cell-level replication or a clean instrument for the within-cell FL margin.
Follow-ups
- Item-group 37 deep-dive: which product category is this? Does the consistent negative coefficient survive year-fixed effects within this group?
- High-value Q4 deep-dive: why does the positive coefficient persist? Is it a damages-reading remnant or a noise floor?
- Buyer-top decomposition (current "Other" cell is too coarse).
- Add macros
\valNegCellConvCoef(−0.062),\valNegCellPregCoef(−0.065),\valSegBetaG37ATT(−0.126),\valSegBetaG10ATT(+0.063) — some already invalues.texas\valNegCellConvCoefetc.