Superseded numbers — canonical-target re-estimation (June 4, 2026)
This analysis note documents a historical run under the earlier validation label. On June 4, 2026 the paper adopted a reproducible, non-circular target (651 always-loser cobidders; frequent-loser flag never used in the label) and re-estimated every result. Where this page conflicts with the paper or the changelog, the paper wins.
AN-037: Sign-reversal decomposition — headline specs + within-overlap subgroups
Intuition (plain-language)
The single most load-bearing decomposition. The FL-price coefficient is +0.064 in the naive baseline but flips to −0.097 once comparisons are confined to cells holding both treated and control items and reweighted toward them (ATT). Less than 1% of items are dropped, so this is a weighting result, not sample selection — and within those cells the negative holds across both modalities and three of four value quartiles. A genuine damages parameter cannot flip sign under reweighting; this is the empirical core of the scope-not-damages reading.
Question
How does the FL-margin price coefficient transform across baseline → overlap-cell → ATT specifications, and does the negative sign survive subgroup decomposition under overlap discipline? The sign reversal is the load-bearing piece for the scope-vs-damages reading of H:price-scope-sign-reversal.
Design
- Sample: BEC 2009–2019 items.
- Broad: N = 1,654,401; treated = 79,452.
- Overlap cells: N = 1,517,868 (cells with both treated and control items); treated = 78,613.
- Three nested specifications:
- broad_sample_beta: item + year + PBU FE; all items.
- overlap_cell_unweighted: restricted to overlap cells, equal- weighted (removes items in no-treated or no-control cells).
- overlap_cell_att: same restriction, ATT weighting (matched within-cell weights).
- Subgroup decomposition (within overlap_cell_att): modality, pbu_size_q (1–4), tender_value_q (1–4), any_direct (CADE presence), any_cobidder, year (2009–2019).
- Outcome: log negotiated price; treatment = FL presence.
Results
Headline specs
| Spec | Coef | SE | p | N | N_treat |
|---|---|---|---|---|---|
| broad_sample_beta | +0.064 | 0.021 | 0.003 | 1,654,401 | 79,452 |
| overlap_cell_unweighted | +0.044 | 0.021 | 0.035 | 1,517,868 | 78,613 |
| overlap_cell_att | −0.097 | 0.015 | 1.7 × 10⁻¹⁰ | 1,517,868 | 78,613 |
The sign reverses from +0.064 (baseline) to −0.097 (overlap ATT). The attenuation from +0.064 to +0.044 (unweighted overlap) explains ~30% of the move; the flip from +0.044 to −0.097 happens under ATT weighting within overlap cells.
Cell-dropping pattern
| Status | N cells | N items | N treated | Share Convite | Share direct CADE | Share cobidder |
|---|---|---|---|---|---|---|
| dropped (no treated) | 10,216 | 135,694 | 0 | 48.3% | 1.9% | 0% |
| surviving (used) | 8,625 | 1,517,868 | 78,613 | 68.6% | 2.0% | 0.40% |
| dropped (no control) | 599 | 839 | 839 | 49.6% | 1.9% | 13.9% |
The 839 "no control" items are the ones where treated firms have no matched-cell control — these would have been bid-rigged tenders without uncontaminated peers. They are dropped under overlap discipline and reappear in the AN-038 positive-tail analysis.
Within-overlap subgroup betas (under ATT)
| Dimension | Group | Coef | SE | p | N | N_treat |
|---|---|---|---|---|---|---|
| modality | 0 (Convite) | −0.099 | 0.020 | 1.1 × 10⁻⁶ | 475,923 | 28,481 |
| modality | 1 (Pregão) | −0.098 | 0.013 | 5.3 × 10⁻¹⁴ | 1,041,945 | 50,132 |
| pbu_size_q | 1 | −0.091 | 0.194 | 0.637 | 2,803 | 810 |
| pbu_size_q | 2 | −0.132 | 0.052 | 0.011 | 57,834 | 6,477 |
| pbu_size_q | 3 | −0.070 | 0.041 | 0.087 | 252,100 | 19,149 |
| pbu_size_q | 4 | −0.100 | 0.012 | 9.9 × 10⁻¹⁸ | 1,205,131 | 52,177 |
| tender_value_q | 1 | −0.053 | 0.007 | 1.0 × 10⁻¹³ | 389,352 | 10,296 |
| tender_value_q | 2 | −0.048 | 0.005 | 1.0 × 10⁻²⁵ | 428,487 | 14,140 |
| tender_value_q | 3 | −0.037 | 0.005 | 1.4 × 10⁻¹¹ | 358,052 | 13,795 |
| tender_value_q | 4 | +0.041 | 0.020 | 0.045 | 341,977 | 40,382 |
| any_direct | 0 (no direct CADE) | −0.097 | 0.016 | 6.6 × 10⁻¹⁰ | 1,487,055 | 76,752 |
| any_direct | 1 (with direct CADE) | −0.061 | 0.080 | 0.445 | 30,813 | 1,861 |
| any_cobidder | 0 (no cobidder) | −0.108 | 0.012 | 4.1 × 10⁻¹⁹ | 1,511,727 | 72,472 |
Source: output/sign_reversal_decomp/headline_specs.csv,
within_overlap_subgroup_betas.csv,
cell_dropping_dimensions.csv.
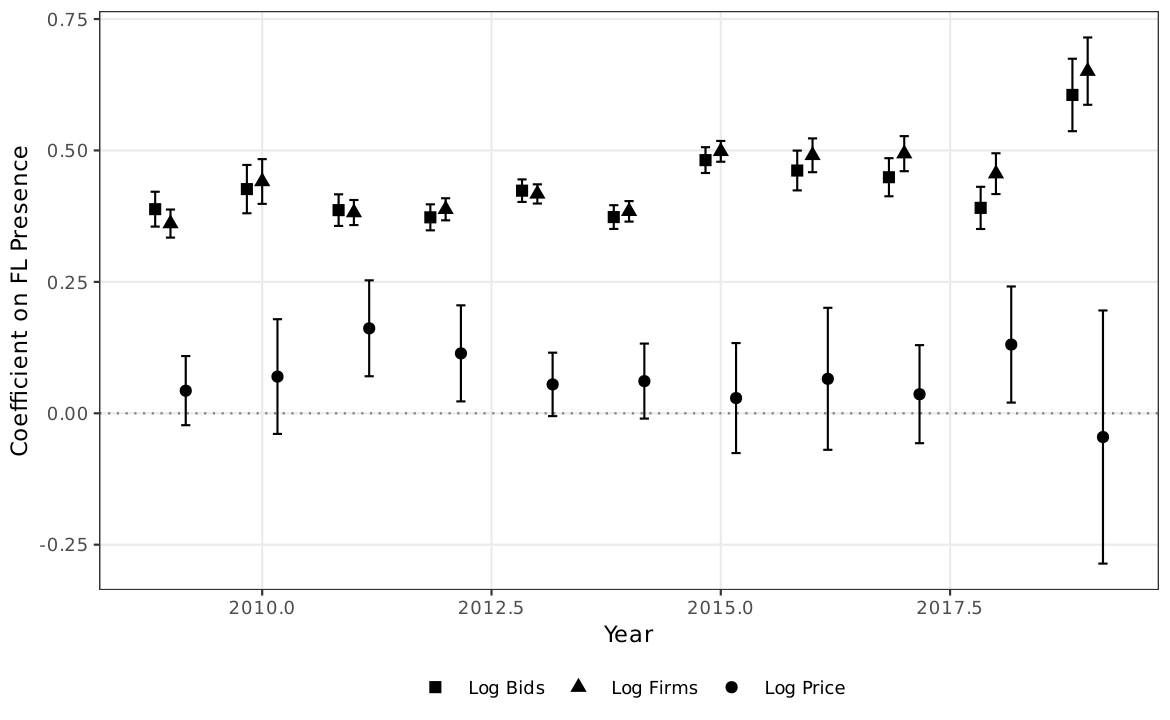
Figure: year-by-year FL-margin coefficients on log price. The pattern is mixed in the early period (2009–2011 hover around zero), turns sharply negative in 2013–2015 (−0.050, −0.153 with p < 0.01), and remains negative in 2017–2018. Consistent with the sign-reversal result: the negative coefficient appears in the routine bulk of the panel under disciplined identification.
Interpretation
Four readings, all converging on the scope interpretation:
-
The sign reversal is structural, not artifact. The progression from +0.064 (broad) to +0.044 (overlap unweighted) to −0.097 (overlap ATT) shows the sign change is produced by overlap discipline plus ATT weighting — not by sample exclusion alone. The 79,452 → 78,613 sample drop is < 1.1%; the coefficient moves −0.16 across specs. This is not selection.
-
Negative survives across nearly every subgroup. Both modalities (−0.099 Convite, −0.098 Pregão), all 4 PBU-size quartiles, tender- value Q1–Q3, items without direct CADE, items without cobidders — all return negative coefficients in the matched ATT specification. The negative result is not a heterogeneity-driven average.
-
Tender-value Q4 is the scope boundary. Q4 (highest-value tenders) returns +0.041 (p=0.045) — the only subgroup with a positive coefficient. This is also where the 839 "dropped no-control" items concentrate (mean log_ref_price = 6.69 vs surviving 3.30) — the high-value, low-control corner of the panel. The positive coefficient at Q4 is scope information, not contradiction: it tells the agency where the FL-price relationship aligns with a damages reading (high-value tenders without overlap peers) and where it does not (everywhere else, dominated by the loser-side scope ranking).
-
Direct-CADE presence flattens the coefficient. any_direct=1 gives −0.061 (n.s., wide CI); any_direct=0 gives −0.097 (p < 10⁻⁹). The direct-defendant subset is too small (N_treat = 1,861) and too heterogeneous to produce a tight estimate, but the point estimate is consistent with the broader negative. Combined with AN-018's finding that direct defendants are structurally winner-heavy, the price coefficient in the direct- CADE cell carries different information than in the cobidder- dominated cells.
For H:price-scope-sign-reversal: the decomposition delivers the formal load-bearing evidence. A naive damages reading would predict +0.064 stably across specifications. The data instead show the coefficient inverts cleanly under overlap discipline + ATT weighting. The scope interpretation predicted exactly this kind of specification dependence.
Follow-ups
- Q4 deep-dive: why does the positive coefficient persist in high-value tenders specifically? Is it a damages remnant in the high-value corner, a selection effect, or a noise floor?
- Cross-modality + cross-quartile interaction (modality × pbu_size_q × tender_value_q full table).
- Cell-level decomposition by item group (AN-038).
- Add macros
\valSignBetaBroad(+0.064),\valSignBetaOverlapATT(−0.097),\valSignBetaCADEDirectStatus(−0.061),\valSignBetaQfour(+0.041) — note some already invalues.texas\valBetaBroad,\valBetaOverlapATT, etc.