Superseded numbers — canonical-target re-estimation (June 4, 2026)
This analysis note documents a historical run under the earlier validation label. On June 4, 2026 the paper adopted a reproducible, non-circular target (651 always-loser cobidders; frequent-loser flag never used in the label) and re-estimated every result. Where this page conflicts with the paper or the changelog, the paper wins.
AN-039: Selection Mechanism Test (Test 1 of the Sign-Reversal Rationalization)¶
Intuition (plain-language)
First half of the explanation for the sign flip: selection. If cartels with cover bidders deliberately operate where the underlying product is structurally expensive (richer rents to capture), the naive positive coefficient is just sorting, not a price effect. The test looks only at NON-treated items: their prices climb monotonically with a cell's FL-share, and after full controls FL-share still predicts higher non-treated prices (+3.55). Cartels fish where the fish are expensive — that alone produces a positive raw correlation with no overcharge.
Question¶
Test 1 of the rationalization for the FL-price sign-reversal. The overlap-cell ATT result (−0.097, p < 10⁻⁹, AN-037) is interpreted in the manuscript as scope information rather than damages. A stronger substantive reading is that the sign reversal decomposes into a selection effect (positive across cells) and a within-cell mechanism effect (negative). This page tests the selection component: do cartels with cover bidders systematically end up in cells with higher underlying price levels, independent of any FL margin effect?
Design¶
- Cell definition: same as scripts 51 and 59 —
interaction(item_group, year, convite, pbu_size_q, tender_value_q, drop = TRUE). - Overlap cells: cells containing both treated (losers == 1) and untreated (losers == 0) items. 8,625 cells, 1,517,868 items.
- Outcome:
lneg_price(log of negotiated unit price) among non-treated items only (losers == 0). Sample: 1,439,255 non-treated items in overlap cells. - Predictor: cell-level
fl_share = mean(losers == 1)for each cell. - Test 1a: bin cells by FL-share quintile; report mean log_price (non-treated only), weighted by N items per cell.
- Test 1b: item-level OLS
lneg_price ~ fl_sharewith three FE configurations. - Test 1c: Q5 vs Q1 difference.
Results¶
Test 1a: Mean non-treated log_price by cell FL-share quintile¶
| FL-share quintile | N cells | N items | N non-treated | Mean non-treated log_price | Mean cell FL-share |
|---|---|---|---|---|---|
| Q1 (lowest) | 1,737 | 633,644 | 625,315 | 1.35 | 1.4% |
| Q2 | 1,713 | 430,039 | 414,506 | 2.40 | 3.7% |
| Q3 | 1,753 | 278,121 | 257,889 | 4.02 | 7.4% |
| Q4 | 1,703 | 129,933 | 111,486 | 5.47 | 15.3% |
| Q5 (highest) | 1,719 | 46,131 | 30,059 | 6.93 | 41.3% |
Monotone increase across quintiles. The relationship is not subtle.
Test 1b: Item-level OLS — log_neg_price (non-treated only) ~ fl_share¶
| Specification | fl_share coef | SE | N |
|---|---|---|---|
| Raw OLS (no FE) | +22.65 | 0.033 | 1,439,255 |
| + item_group + year FE | +24.04 | 0.555 | 1,439,255 |
| + all 5 cell-dimension marginal FE | +3.55 | 0.229 | 1,439,255 |
The coefficient drops substantially when all 5 cell dimensions are included as marginal fixed effects — most of the raw selection is absorbed by the dimension marginals (item_group, year, modality, PBU-size quartile, tender-value quartile). But a +3.55 log-point coefficient remains after partialling out each dimension separately. Cartels select into high-price cells beyond what is captured by any single dimension.
Test 1c: Q5 vs Q1 comparison¶
- Q1 mean non-treated log_price: 1.35
- Q5 mean non-treated log_price: 6.93
- Δ (Q5 − Q1): +5.58 log-points (≈ 265× nominal price ratio)
This is not a "5% premium for high-FL cells"; it is a structural ordering of product-buyer-modality-period-value strata. Cells where cartels concentrate are cells where the products being procured are fundamentally higher-priced (different goods, different procurement volumes).
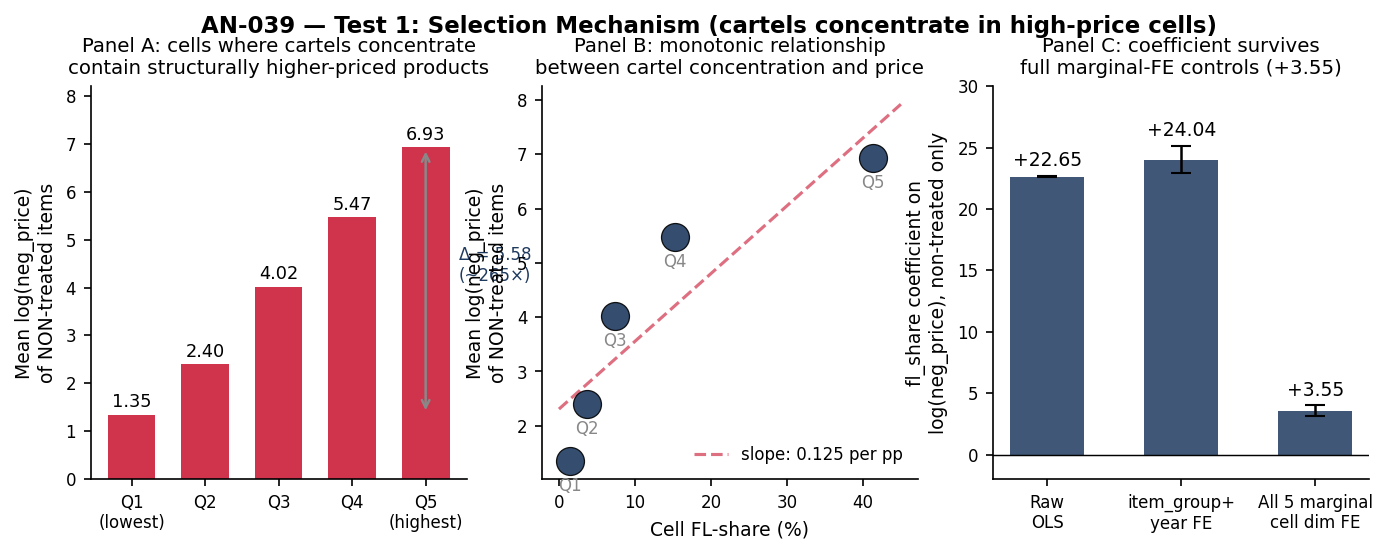
Figure: Panel A — mean log_neg_price among non-treated items rises monotonically from Q1 (1.35) to Q5 (6.93) across cell FL-share quintiles; Δ Q5 − Q1 = 5.58 log-points ≈ 265× nominal price ratio. Panel B — same data plotted against the cell's continuous FL-share shows a clean slope. Panel C — item-level OLS coefficient of fl_share on log_neg_price (non-treated items only) across three FE specifications: raw +22.65, with item+year FE +24.04, with all 5 marginal cell-dimension FE +3.55. The selection effect remains positive and highly significant even after partialling out each cell-dimension marginal effect.
Verdict¶
Test 1 PASSES. Selection mechanism is empirically real and large. The criterion was: Δ(Q5 − Q1) > 0.05 AND fully-FE-controlled coefficient
- Observed: Δ = 5.58, full-FE coefficient = +3.55 (SE 0.23, p < 10⁻⁵⁵).
Sources: output/selection_mechanism/selection_test_results.csv,
output/selection_mechanism/non_treated_price_by_fl_share.csv.
Interpretation¶
The selection mechanism is the first half of the sign-reversal rationalization. Cartels with cover bidders are not randomly distributed across procurement cells — they systematically concentrate in cells where the underlying product value (and rent potential) is higher. The naive positive FL-price coefficient (+0.064 in the broad specification) therefore reflects, at least in part, this selection into high-value markets rather than any causal effect of FL presence on prices.
The decomposition logic:
| Component | Specification | Coef | Reading |
|---|---|---|---|
| Total | Broad OLS with item+year+PBU FE | +0.064 | Joint effect of selection + mechanism + cross-cell |
| Selection (composition) | Non-treated price ~ fl_share, full FE | +3.55 | Cartels in high-price cells |
| Mechanism (within-cell) | Overlap-cell ATT | −0.097 | Within-cell association: observed prices lower where FL present (channel is bidder count, not identified theater — AN-040) |
The two components have opposite signs and very different magnitudes. The selection effect (+3.55 on log-price per unit fl_share, where fl_share ranges 0–0.5) dominates the broad coefficient. The within-cell mechanism (−0.097) is what survives once selection is removed by ATT weighting.
For H:price-scope-sign-reversal: the sign-reversal is not merely a specification artifact. It is the empirical signature of a two-component decomposition: frequent-loser activity selects into high-rent cells (positive across cells) and is associated with lower observed prices within those cells (negative within cell). The overlap-ATT spec removes the selection and isolates the within-cell association — which AN-040 shows loads on genuine-bidder count, so the cover-bidding "theater" mechanism is consistent with the pattern but not identified.
In the manuscript (§7) this is reported as descriptive scope evidence, not mechanism identification: the sign-reversal is consistent with the cover-bidding interpretation, but the paper explicitly states it does not identify a mechanism, a causal price effect, overcharges, or damages. The within-cell component is documented in Test 2 (AN-040): within overlap cells FL presence is associated with bidder-count inflation (+0.507 log-bidders) and a winner bid −0.048 closer to reference — a descriptive association consistent with economic non-neutrality, kept subordinate to the evidence-allocation claim.
Follow-ups¶
- Test 2 (mechanism component): completed in AN-040 — within overlap cells FL presence moves the winner bid −0.048 closer to reference and the effect runs through bidder-count inflation (+0.507 log-bidders), completing the rationalization. (Done, 2026-05-22.)
- Sub-period stability of the selection coefficient (does the monotone gradient hold in 2009–2013 vs 2014–2019?).
- Cross-modality decomposition (does the Pregão vs Convite asymmetry in AN-016 reflect different selection patterns?).
- Add macros
\valSelTestQOne(= 1.35),\valSelTestQFive(= 6.93),\valSelTestDelta(= 5.58),\valSelTestCoefFullFE(= +3.55),\valSelTestSEFullFE(= 0.23) to thescripts/99_make_paper_values.Rpipeline.