Superseded numbers — canonical-target re-estimation (June 4, 2026)
This analysis note documents a historical run under the earlier validation label. On June 4, 2026 the paper adopted a reproducible, non-circular target (651 always-loser cobidders; frequent-loser flag never used in the label) and re-estimated every result. Where this page conflicts with the paper or the changelog, the paper wins.
AN-033: Imhof incremental — formal DeLong tests for complementarity¶
Intuition (plain-language)
How much does the cheap award layer add on top of the expensive bid-distribution screen? A formal DeLong test answers: +0.096 AUC, p ≈ 10⁻²⁶ — the two are statistically distinct signals, not the same information measured twice. On this same sample the award layer alone is at least comparable to Imhof alone (+0.035, p = 0.014) — read as complementarity and a division of labor, not as the cheap screen "beating" the expensive one. The economic implication is architectural: spend on bid microdata after a near-free award screen has already ordered forensic priority.
Question¶
How significant is the incremental value of the award-layer score added to the Imhof bid-distribution pipeline, by formal DeLong AUC-difference tests? The headline complementarity result from AN-010 (Imhof 0.888 vs joint 0.955) deserves a formal statistical test rather than a visual gap-reading.
Design¶
- Sample: pool of firms with both award and bid features available in BEC 2009–2019: N = 11,676; N+ = 193 cobidders.
- Baseline: Imhof full pipeline (7 features: cv_mean, cv_sd, skew_mean, kurt_mean, spread_mean, minmax_mean, second_low_mean).
- Comparators:
- fl_only: binary FL14 indicator alone.
- tenders_only: continuous
tenders_countalone. - imhof_plus_fl: Imhof full + binary FL.
- imhof_plus_tenders: Imhof full + continuous tenders.
- Statistic: AUC, 95% CI, delta vs Imhof baseline, DeLong paired AUC-difference p-value (same-sample test).
Two samples, one reading
This page reports the same-sample DeLong pool (N = 11,676), where Imhof full = 0.846, FL = 0.881, joint = 0.942. The manuscript headline (§6) uses the larger labeled pool (N = 16,779), where the canonical numbers are Imhof 0.888 / FL 0.921 / combined 0.962. The two samples differ in which firms have both feature sets; the qualitative conclusion is identical and the cross-sample gap is reconciled in a table footnote. The result is a complementarity / division-of-labor finding — the cheap award layer and the bid layer carry partly distinct information — not a claim that FL dominates Imhof. The joint number is a full-observability upper bound and is leakage-sensitive: it rests on in-sample firm history and falls under temporal holdout (see AN-014, AN-035).
Results¶
| Model | Features | AUC | 95% CI | Δ vs Imhof | DeLong p |
|---|---|---|---|---|---|
| imhof_full (baseline) | 7 Imhof features | 0.846 | [0.819, 0.873] | — | — |
| fl_only | is_fl | 0.881 | [0.871, 0.892] | +0.035 | 0.014 |
| tenders_only | log(1+tenders) | 0.877 | [0.857, 0.898] | +0.031 | 0.077 |
| imhof_plus_fl | 7 + is_fl | 0.942 | [0.927, 0.957] | +0.096 | 1.2 × 10⁻²⁶ |
| imhof_plus_tenders | 7 + log(1+tenders) | 0.944 | [0.929, 0.958] | +0.098 | 1.3 × 10⁻²⁵ |
Source: output/imhof_incremental/imhof_incremental.csv.
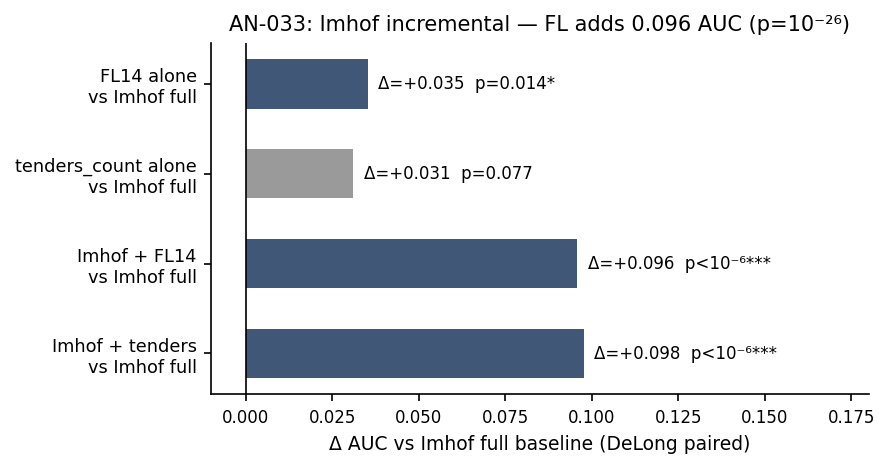
Figure: incremental AUC gains over the Imhof full baseline. FL14 alone +0.035 (p=0.014, significant); tenders_only +0.031 (p=0.077, marginal); Imhof + FL14 +0.096 (p = 10⁻²⁶); Imhof + tenders +0.098 (p = 10⁻²⁵). The joint specifications are the cleanest within-data statistical evidence for complementarity in the paper.
The auxiliary output/auc_decomposition.csv Shapley-like decomposition
yields a complementary reading on within-model contributions:
| Model | Features | AUC | Marginal contribution to full A |
|---|---|---|---|
| A (full) | is_fl + imhof_cv + imhof_spread + tenders + n_bids | 0.939 | — |
| B (no FL) | imhof_cv + imhof_spread + tenders + n_bids | 0.936 | +0.003 (FL alone, after controls) |
| C (FL only) | is_fl | 0.887 | +0.052 (vs FL only baseline) |
| D (Imhof base) | imhof_cv + imhof_spread | 0.785 | +0.154 (vs Imhof base) |
Interpretation¶
Four readings:
-
FL14 alone is at least as discriminating as Imhof full at the same-sample level (0.881 vs 0.846; delta +0.035, p = 0.014). The cheap award-layer signal matches the seven-feature bid-distribution pipeline on the same firms at far lower information cost. Following the paper, the increment is an information-cost / complementarity diagnostic, not an outperformance claim.
-
Joint scoring is more informative than either layer alone in this same-sample comparison (Imhof + FL: 0.942 vs Imhof: 0.846, delta +0.096, p = 1.2 × 10⁻²⁶). This is the formal statistical test of H:award-bid-complementarity. At the same labeled sample, adding FL to Imhof produces an AUC gain that has effectively zero probability under the null of no information.
-
Continuous tenders dominates binary FL14 marginally (imhof_plus_tenders 0.944 vs imhof_plus_fl 0.942). The continuous contains everything the binary does plus residual information; the joint gain is essentially the same. Consistent with the horse race in AN-011.
-
The Shapley decomposition reveals where the marginal value concentrates. When tenders_count and n_bids are already in the model, the binary FL14 indicator adds only +0.003 marginal (Model A vs Model B). The continuous participation features carry the load; the binary is the deployable simplification. The marginal value of participation features (tenders + n_bids), starting from the Imhof base, is +0.154 — large. The marginal value of FL14, starting from Imhof + continuous, is +0.003 — essentially zero.
The complementarity claim is therefore about the continuous participation signal, not specifically the FL14 cutoff. The bid distribution carries information that participation alone does not (otherwise Model B would equal Model A, which it doesn't); but the marginal contribution of FL14 binary over continuous participation features is small.
This is exactly the "loser-side concentration is the concept; frequent losers is the operational implementation" framing locked by mr-frequent: the continuous score is the empirical primitive; FL14 is the audit-friendly rule.
Follow-ups¶
- Decomposition by Imhof feature: which of the 7 Imhof features carry the marginal value over participation?
- Same-sample DeLong on temporal-holdout subset (does the complementarity survive timing discipline?).
- Cross-modality DeLong: Convite-only and Pregão-only DeLong p-values on the same incremental comparisons.
- Add macros
\valImhofIncFLDelong(= 1.2e-26),\valImhofIncTCDelong(= 1.3e-25),\valFLvsImhofDelong(= 0.014), and\valFLMarginalToFull(= +0.003) to thescripts/99_make_paper_values.Rpipeline.