Superseded numbers — canonical-target re-estimation (June 4, 2026)
This analysis note documents a historical run under the earlier validation label. On June 4, 2026 the paper adopted a reproducible, non-circular target (651 always-loser cobidders; frequent-loser flag never used in the label) and re-estimated every result. Where this page conflicts with the paper or the changelog, the paper wins.
AN-024: Unified mechanism profile
Intuition (plain-language)
Where does the FL-price association live across a market-concentration × pair-density grid? The biggest mass sits in the Low-HHI × Low-pairs cell (+9.98), and the sign even flips in a high-density cell (−7.92). The earlier temptation was to read this as a cartel signature. The locked stance refuses that: it is descriptive heterogeneity consistent with cover bidding, not proof of a mechanism. Calling a pattern a signature is exactly the overclaim the paper is built to avoid.
Question
How does the unified mechanism profile (HHI × pairs × heterogeneity quadrants) characterize FL cobidders relative to other FLs?
Design
- Sample: FL14 stratum × HHI × pairs density quadrants.
- Specification: two-dimensional profile of HHI (low/high) × cobidder-pair density (low/high) × heterogeneity (low/high); conditional cobidder-rate outcomes per cell.
- Estimation: N = 1,654,401 mechanism-sample observations
(
\valMechSampleN).
Results
| Cell (HHI × pairs × het) | Coefficient | p | N |
|---|---|---|---|
| Low × Low × Low (QLLL) | +9.98 | 5.8e-05 | 1,327,417 |
| Low × Low × High (QLLH) | +2.72 | 0.179 | 105,862 |
| Low × High × Low (QLHL) | +6.78 | 0.075 | 208,731 |
| Low × High × High (QLHH) | −7.92 | 0.002 | 6,496 |
Macros: \valMechQLLLCoef, \valMechQLLLP, \valMechQLLLN,
\valMechQLLHCoef, \valMechQLHLCoef, \valMechQLHHCoef, plus the
matching *P and *N macros.
Auxiliary v8 mechanism statistics (consolidated):
\valMechCrowdInUC (+0.184), \valMechBidsPerTender (+0.219),
\valMechRegimeSpread (+0.255), \valMechRegimeNeg (−0.056),
\valMechBoundaryNeg (−0.160).
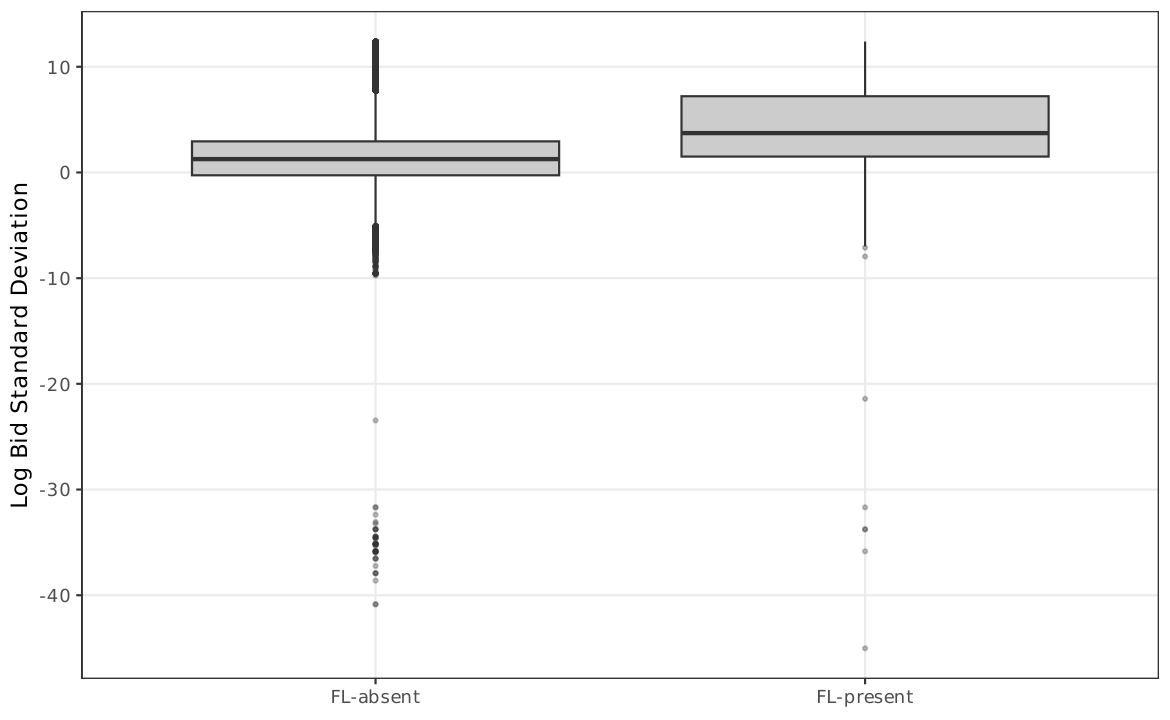
Figure: regime boxplots of the FL margin across the HHI × pairs quadrants. The Low-Low cell carries the mass; the QLHH cell has the sign-flipping pattern (−7.92, p = 0.002) but small N (6,496) and small effect mass.
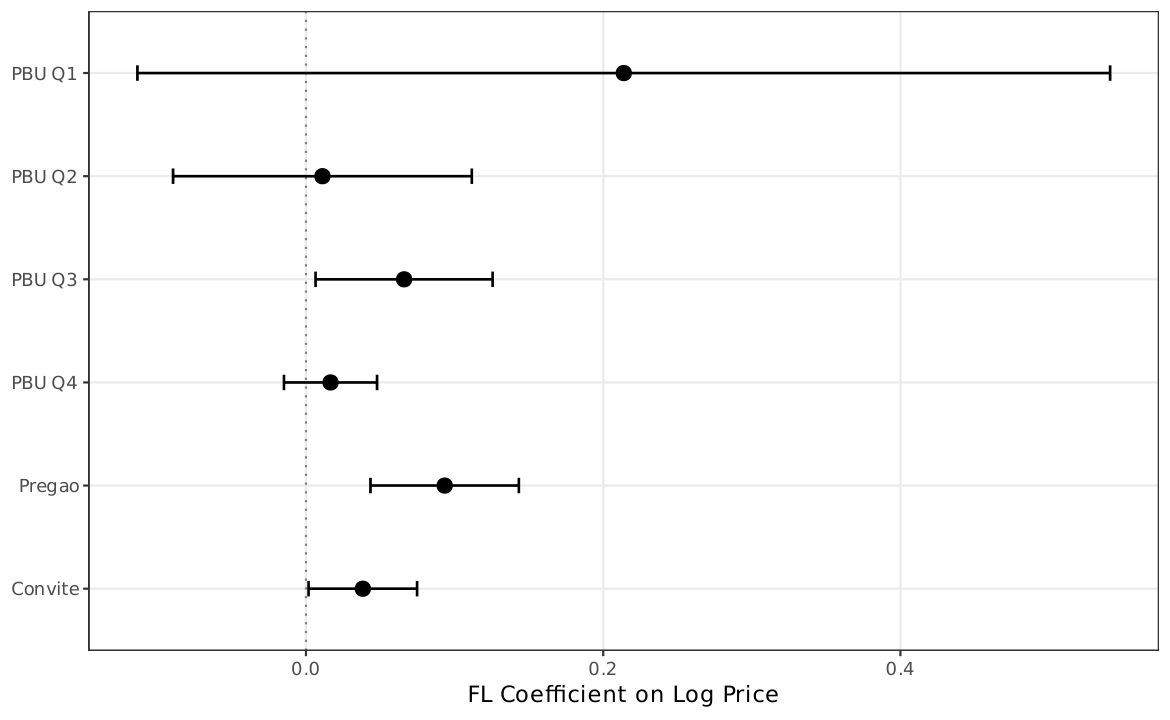
Figure: FL-margin coefficient by oversight strength (PBU size quartile). Q1 (smallest PBUs, weakest oversight) carries the largest positive coefficient; Q4 (largest PBUs, strongest oversight) carries the smallest — consistent with the "loser-side concentration is more visible where institutional discipline is weaker" reading.
Interpretation
The largest cell by mass is Low-HHI × Low-pairs × Low-heterogeneity (+9.98, N = 1.3M), which is also the diffuse-market baseline. The sign-flipping cell (Low × High × High, −7.92, N = 6,496) is small and specific; it cannot be promoted to "the cartel signature" without overreach.
Locked rule of engagement (mr-frequent rounds 2–4): drop the "assinatura de cartel" framing. The profile is descriptive and shows where the cobidder concentration sits in the cross-section, not a mechanistic identification of cartel structure. The pattern is consistent with loser-side cover-bidding deployment, not diagnostic.
The unified profile sits alongside:
- the buyer-breadth and operational-footprint pattern (AN-008);
- the HHI cobidder vs non-cobidder split (AN-009).
Together these three give the cobidder-distinct narrative (H:cobidder-profile-distinct) its descriptive content. None of them is forensic proof; the proof-producing stage remains in the bid layer (AN-010).
Follow-ups
- Re-estimate within audit-disciplined sample (AN-014).
- Sub-period stability.
- Triangulation with the dyadic-permutation pattern (
\valDyadicRatio= 5.9;\valDyadicTopTenRatio= 2.0).