Superseded numbers — canonical-target re-estimation (June 4, 2026)
This analysis note documents a historical run under the earlier validation label. On June 4, 2026 the paper adopted a reproducible, non-circular target (651 always-loser cobidders; frequent-loser flag never used in the label) and re-estimated every result. Where this page conflicts with the paper or the changelog, the paper wins.
AN-008: Cobidder buyer breadth and operational footprint
Intuition (plain-language)
If cobidders are deployed as cartel cover, they should look operationally busier than ordinary frequent losers. They do: inside the FL14 stratum, cobidders bid in ~2× as many tenders (136.5 vs 76.7) and brush past ~2× as many distinct winners (24.8 vs 13.5), at large effect sizes (Cohen's d ≈ 0.7–1.0). The profile fits firms assigned to populate many auctions rather than firms that happen to bid broadly. Whether this survives once sheer volume is netted out is the question AN-041 confronts.
Question
Within the FL14 stratum, how do cobidders differ from non-cobidder FLs along buyer breadth and operational footprint? The test is within- stratum, controlling for tenders_count.
Design
- Sample: FL14 stratum (always-losers above the IQR cutoff).
- Cobidder vs non-cobidder-FL split.
- Outcomes: mean tenders per firm, unique winners crossed, number of buyer-product groups, repeat-buyer share.
- Effect sizes: standardized Cohen's d alongside raw means.
Results
| Metric | Cobidders | Non-cobidder FL | Cohen's d |
|---|---|---|---|
| Mean tenders per firm | 136.5 | 76.7 | +0.67 |
| Unique winners crossed | 24.8 | 13.5 | +1.00 |
| Share with a direct-defendant counterpart | 1.5% | 0.2% | +0.46 |
| Number of buyer-product groups | 7.6 | 9.5 | −0.32 |
| Repeat-buyer share | 21.6% | 33.4% | −0.38 |
Macros: \valBridgeTendCob, \valBridgeTendFLnc, \valBridgeTendD,
\valBridgeUniqWinCob, \valBridgeUniqWinFLnc, \valBridgeUniqWinD,
\valBridgeDirectCob, \valBridgeDirectFLnc, \valBridgeNGroupsCob,
\valBridgeNGroupsFLnc, \valBridgeRepeatShareCob,
\valBridgeRepeatShareFLnc.
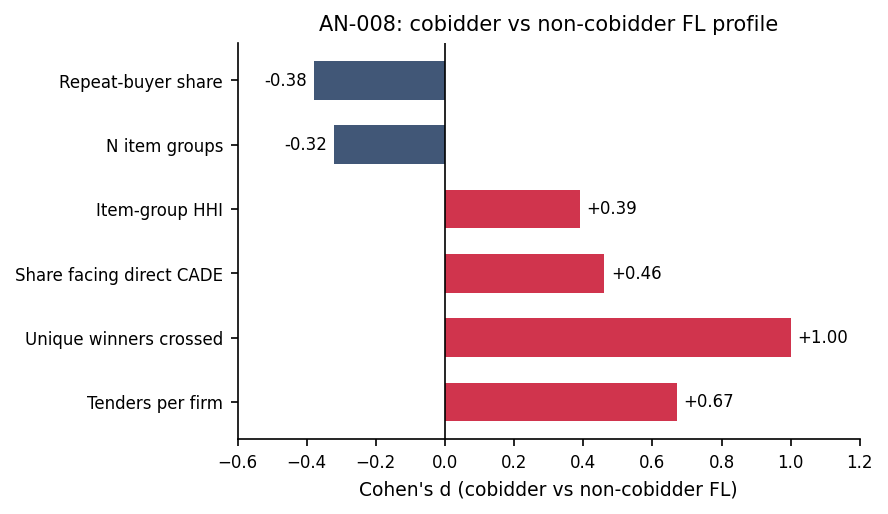
Figure: Cohen's d of cobidders vs non-cobidder FLs across six profile dimensions. Positive (red): cobidders higher on tenders, unique winners crossed, share facing direct CADE, item-group HHI. Negative (navy): cobidders lower on n item groups and repeat-buyer share. Within-FL14 distinctness is robust across multiple dimensions.
Interpretation
Inside the FL14 stratum, cobidders are deployed more broadly (more tenders, more unique winners crossed) but in tighter focal portfolios (fewer buyer-product groups, lower repeat-buyer share). The pattern is consistent with cover-bidding deployment — broad coverage across the tenders where the cartel operates, concentrated in a few product verticals — and not with random high-volume losing. The Cohen's d magnitudes (0.3–1.0) are large in social-science terms.
This is descriptive, not diagnostic: the profile is consistent with credible losing roles, not proof of them. The proof-producing stage remains the bid layer (AN-010).