AN-007: Quantile DiD across the conditional price distribution¶
Intuition (plain-language)
The average price effect hides where the action is. Open competition cuts prices most at the cheap end of the distribution, where competitive bidders bunch, and even reverses sign at the very top. The gain from competition is concentrated in the bulk of ordinary contracts, not spread evenly.
Reduced-form motivation layer
The numbers below are from the v1–v4 reduced-form DiDiR pipeline
(scripts/02_analysis.R + companions), which the v8 manuscript
carries as motivation in §1 but does not headline. The canonical
v8 result is the structural counterfactual decomposition — see
AN-010 (decomposition) and
AN-011 (welfare arithmetic).
Question¶
The DiDiR mean coefficient in AN-001 is an average effect across the conditional price distribution. How does the open-competition price effect vary along the distribution? Canay (2011) quantile DiD estimates the treatment effect at specified quantiles.
Design¶
- Sample: same as AN-001; 18-month window; completed items.
- Specification: Canay (2011) quantile DiD applied to log prices at \(\tau \in \{0.10, 0.25, 0.50, 0.75, 0.90\}\).
- Outcomes: conditional quantiles of log prices.
Results¶
| \(\tau\) | β | SE | p |
|---|---|---|---|
| 0.10 | −0.623 | 0.028 | <0.01 |
| 0.25 | −0.543 | 0.023 | <0.01 |
| 0.50 | −0.356 | 0.024 | <0.01 |
| 0.75 | +0.031 | 0.032 | n.s. |
| 0.90 | +0.445 | 0.045 | <0.01 |
| OLS benchmark | −0.124 | 0.017 | <0.01 |
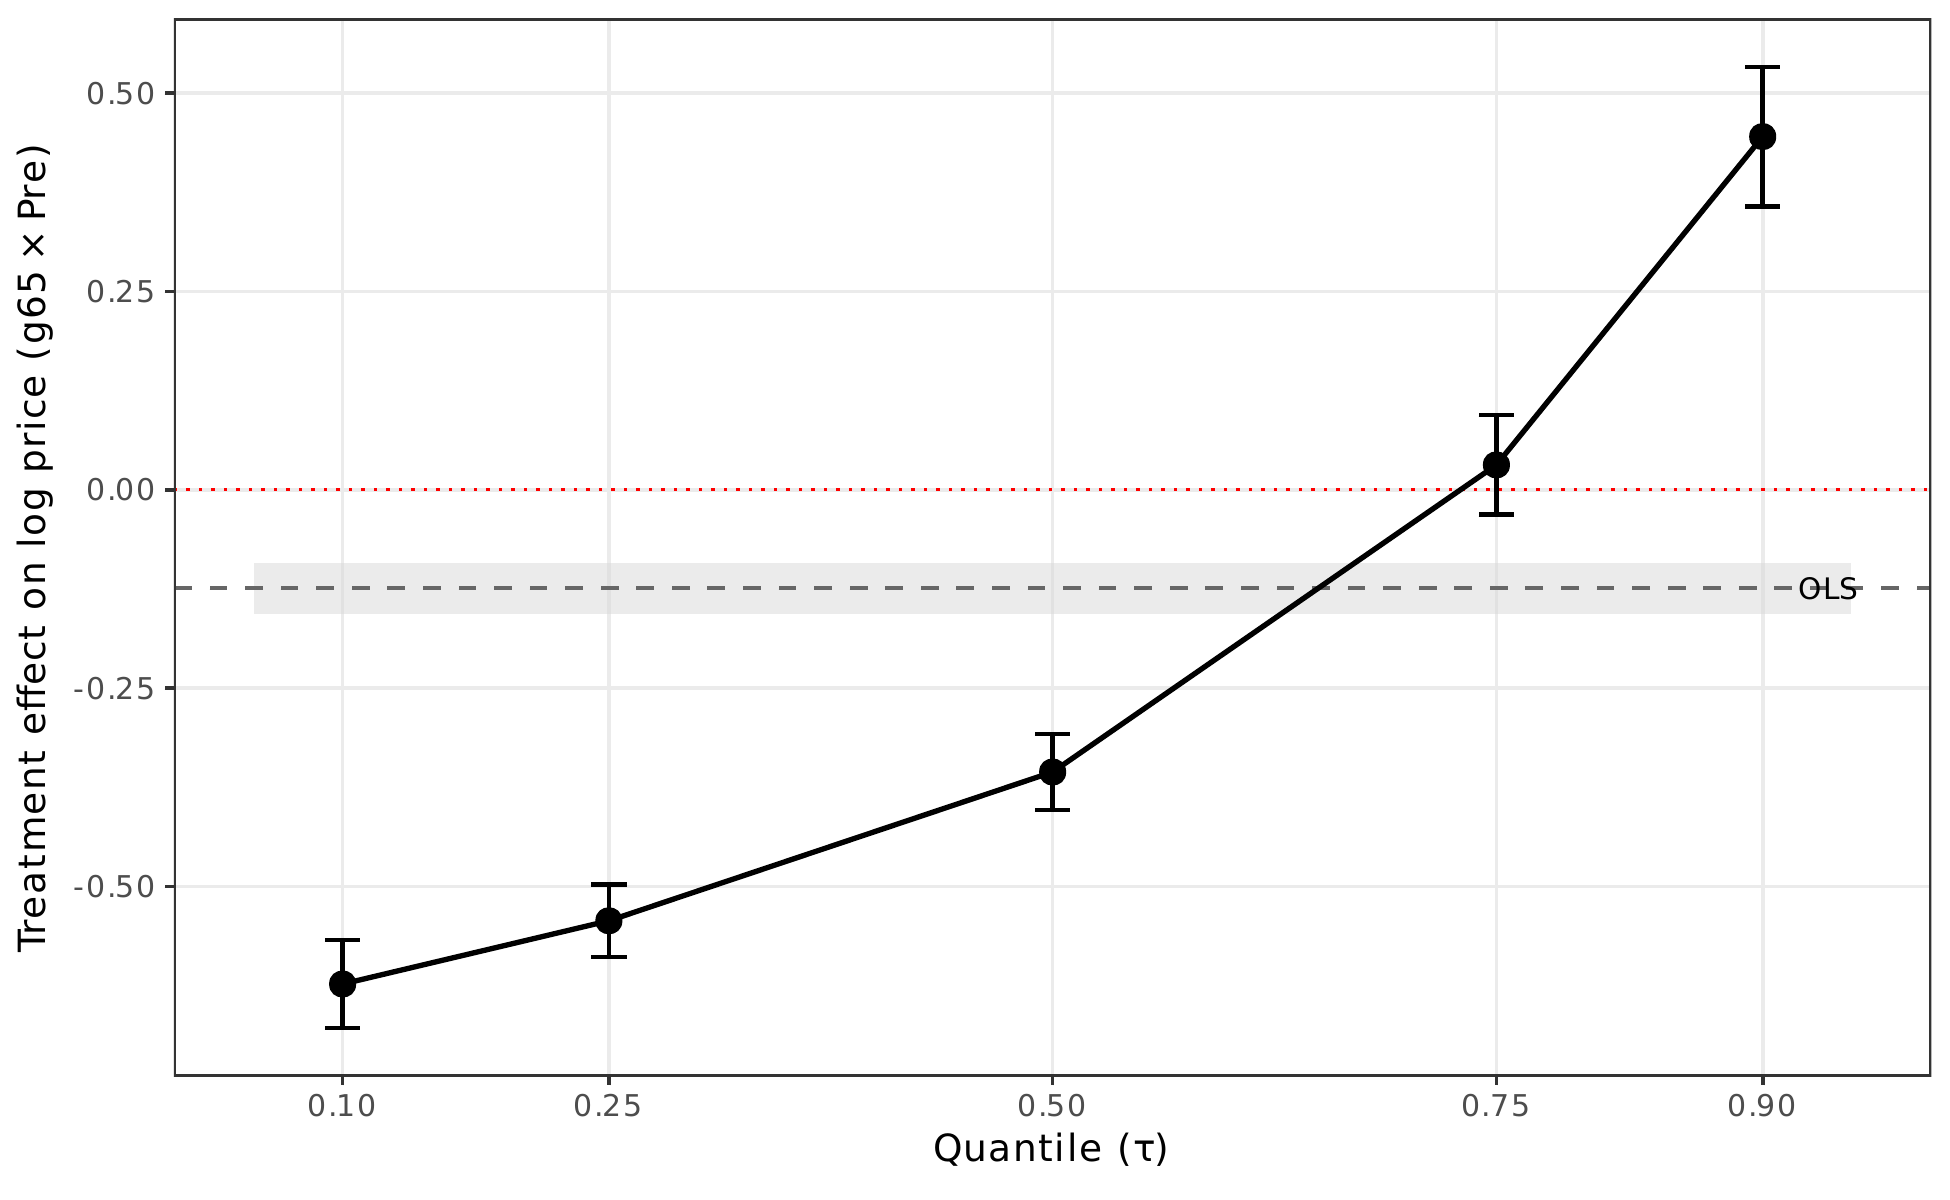
Coefficients across the conditional price distribution: strongly negative at low quantiles, reversing at the upper tail.
Output: output/tables/tab_quantile_did.tex,
output/figures/fig_14_quantile_did.pdf.
Interpretation¶
The benefits of open competition concentrate at the lower quantiles of the conditional price distribution: \(\tau \leq 0.50\) shows strongly negative coefficients. At \(\tau = 0.90\), the effect reverses to positive — possibly reflecting specialized items with thin supplier markets where opening the auction up admits a price-raising selection of non-SMEs (e.g., specialized medical equipment from a small pool of qualified suppliers).
The OLS benchmark (−0.124) sits between the median quantile DiD (−0.356) and the \(\tau = 0.75\) coefficient (+0.031), illustrating that the mean coefficient is not a clean summary of the distributional impact.
Confidence: yellow. The distributional reading is informative but the standard errors are larger than for the mean coefficient. The direction at the lower quantiles is robust; the reversal at \(\tau = 0.90\) is the most-interesting and most-uncertain finding.
Follow-ups¶
- Item-class decomposition of the upper-tail reversal: which item subcategories drive the positive coefficient at \(\tau = 0.90\)? Specialized medical equipment vs reagents vs disposables.
- A Frandsen-Lalive-Reinhold conditional-quantile decomposition could isolate composition effects (different items being completed in pre- vs post-period) from genuine distributional shifts in price formation.